07 / Retail
Retail
Management
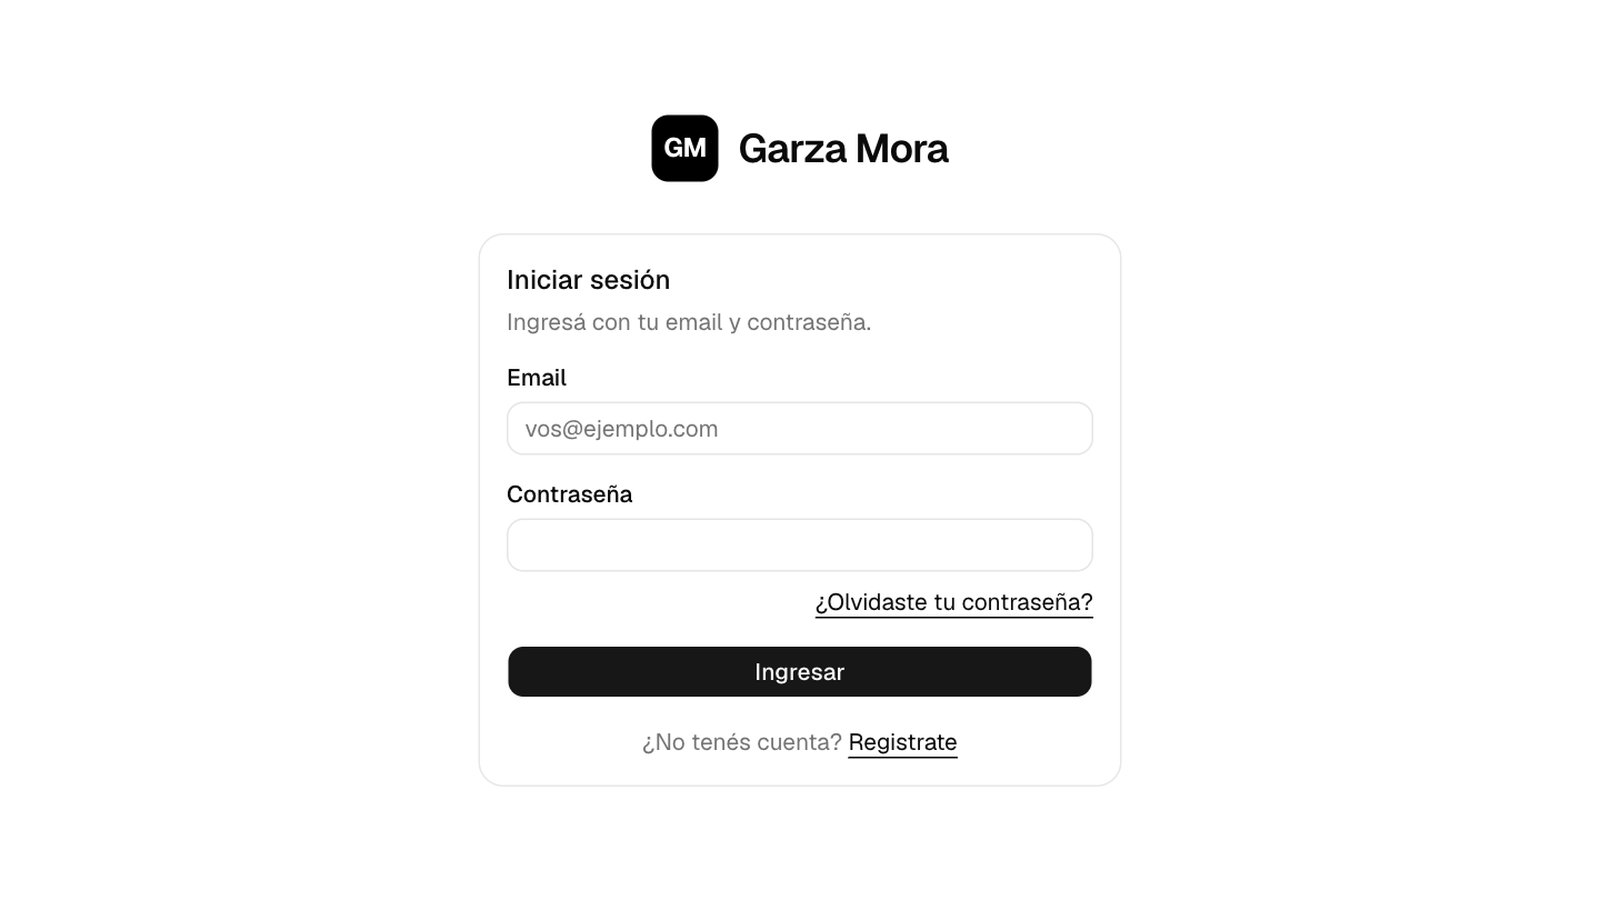
A full UI revamp and a new product management model for Garza Mora, a store selling pottery, textiles, and handwoven goods. One internal dashboard to control inventory, stock movements, and sales, with each role seeing only what it needs.
Role
Title
Design Engineer
Sector
Retail
Scope
Design · Frontend · Architecture
Context
Garza Mora is a store for pottery, textiles, weaving, and home decor, run by its owner with a salesperson at the counter. The existing system had grown in pieces, with overlapping data models that did not fit the way the store actually works.
We revamped the whole interface and designed a product management model from the ground up: products, categories, stock movements, sales, and payments. The goal was simple: the stock the system shows has to be explainable. If it says 12 and there are 9 on the shelf, the movement history tells you why.
Contributions
UI Revamp
Replaced the previous client with a new Next.js dashboard built on shadcn/ui and Tailwind. A single entry screen shows what matters: active products, stock value at cost, items to restock, and items out of stock.
Product Management Model
Designed the data model for products, categories, stock movements, sales, and payments. Every stock change is recorded as a movement with its reason and the person responsible.
Inventory Insights
Restock alerts sorted by urgency, stock value by category as horizontal bars with labeled amounts, product search and filters, and daily sales with monthly gross profit.
Roles & Permissions
Permissions live in the database, not the UI. The salesperson works with stock but never sees sales or profitability: the query does not run, even when the URL is typed directly.
Key Design Decisions
Decision
Status never relies on color alone
Outcome
Stock status shows an icon and a label ("Restock", "Out of stock") with color as support, so it stays readable for everyone.
Decision
Bars instead of a pie chart
Outcome
Stock value by category is a comparison between a few named groups. Comparing lengths is far more accurate than comparing angles, and each bar carries its amount, so no tooltip is needed.
Decision
Server-rendered data
Outcome
Pages fetch data on the server and the aggregation happens in Postgres, so the dashboard loads ready to read and always reflects the current state.